In today’s data-driven world, the terms “Data Analytics” and “Business Intelligence (BI)” are often thrown around interchangeably. However, these two concepts, while closely related, serve very different purposes in an organization’s decision-making process. Understanding the nuances between data analytics and business intelligence is important for professionals looking to make a significant impact in their field.
This article will help you understand the distinctions between data analytics and BI, explore their respective roles in organizational decision-making, and provide real-world examples that bring these concepts to life.
Understanding Data Analytics
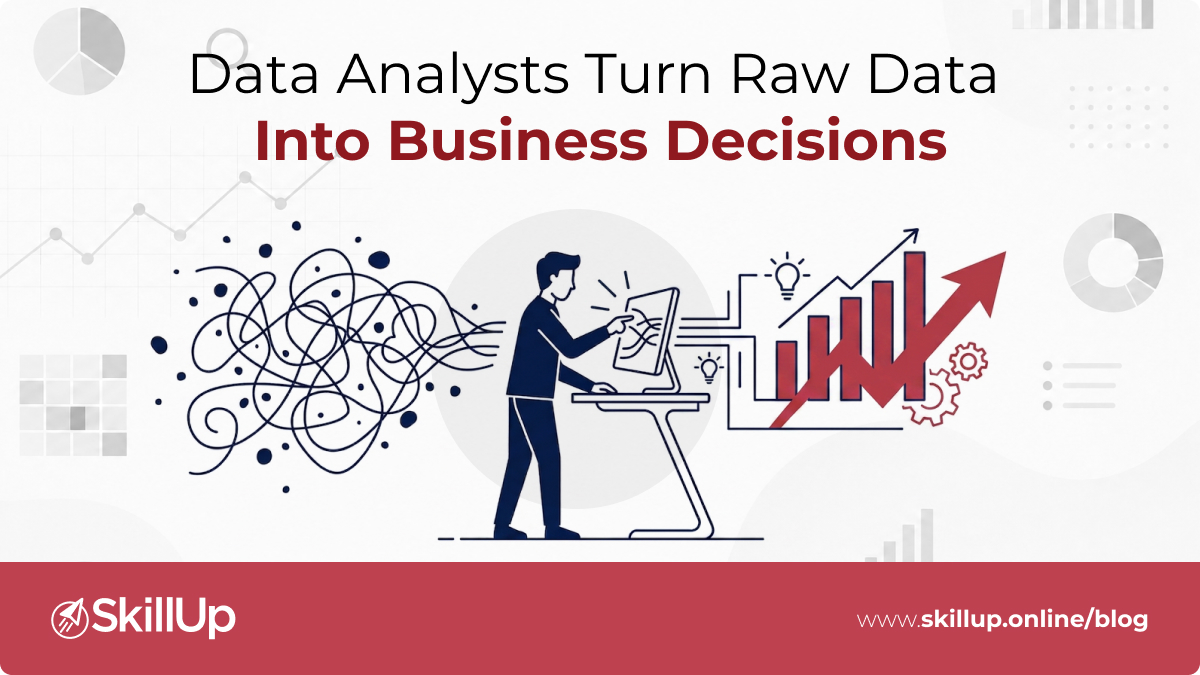
Data analytics is a systematic approach to examining raw data with the intent of discovering valuable insights. The core purpose of data analytics is to sift through mountains of data to identify patterns, trends, and anomalies that can inform strategic decisions.
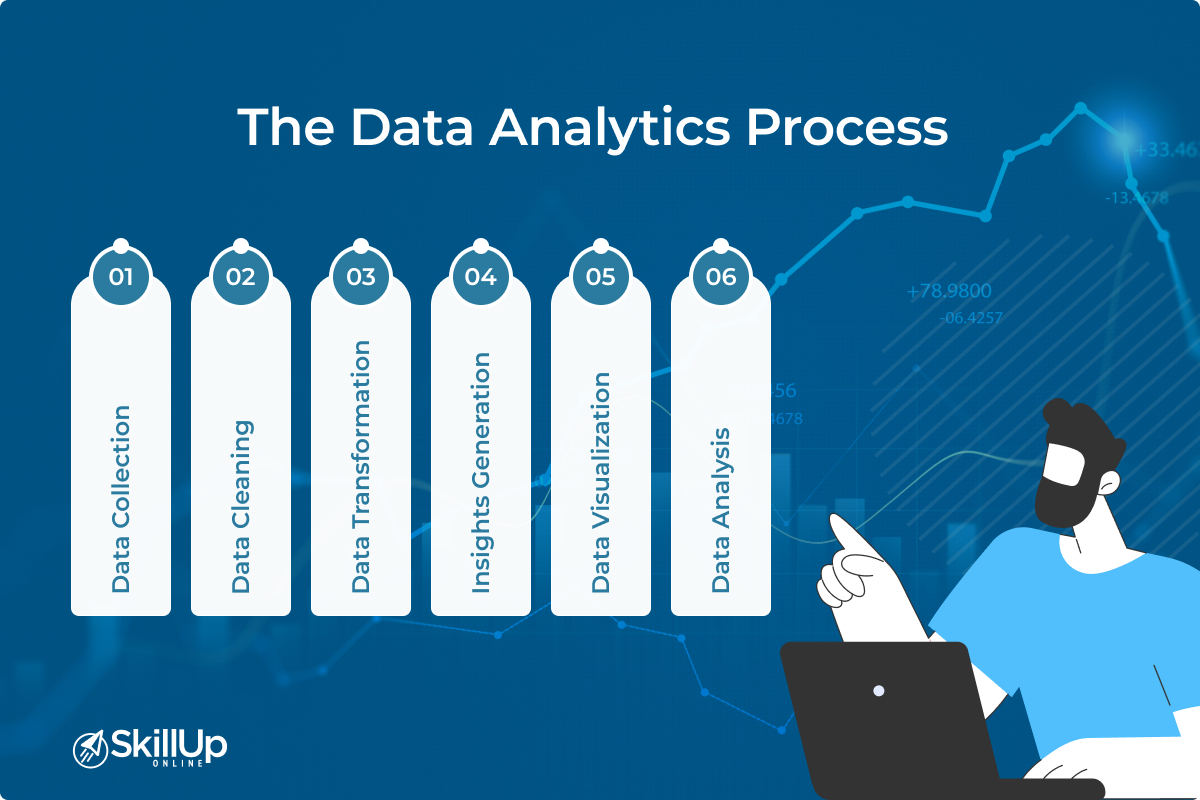
The Data Analytics Process
Data analytics is a series of steps that ensure the data you analyze is reliable and leads to actionable insights. The typical process comprises six key phases:
- Data Collection: Gathering raw data from various sources like sensors, user interactions, or business transactions.
- Data Cleaning: Removing or correcting any inaccuracies in the data to ensure quality and reliability.
- Data Transformation: Converting data into a format that can be easily analyzed.
- Data Analysis: Employing statistical tools to unearth valuable insights from the cleaned and transformed data.
- Data Visualization: Presenting the analysis in an easily understandable format using charts, graphs, and dashboards.
- Insights Generation: Interpreting the visual data to make informed decisions.
Data Analytics in Practice
Data analytics has found its application across all industries. Some examples include:
- Marketing: By analyzing customer behavior and preferences, companies can tailor more effective marketing campaigns.
- Finance: Data analytics assists in identifying investment opportunities and managing risk.
- Healthcare: Data analytics aids in predicting disease outbreaks and offers insights into patient care improvement.
- E-Commerce: Recommending products based on user browsing and purchase history improves customer experience.
While examples can help you understand the application of data analytics in various industry, to get a hands-on feel, you could explore taking a Power BI Data Analyst course. This course will help you get a real-life feel of how data analytics is done and how the same is represented visually.
Understanding Business Intelligence
While data analytics digs deep into raw data to uncover insights, business intelligence (BI) serves a different role by transforming data into strategic insights through reporting, querying, and data visualization.
The Business Intelligence Process
The BI process is a well-structured approach that comprises several vital steps:
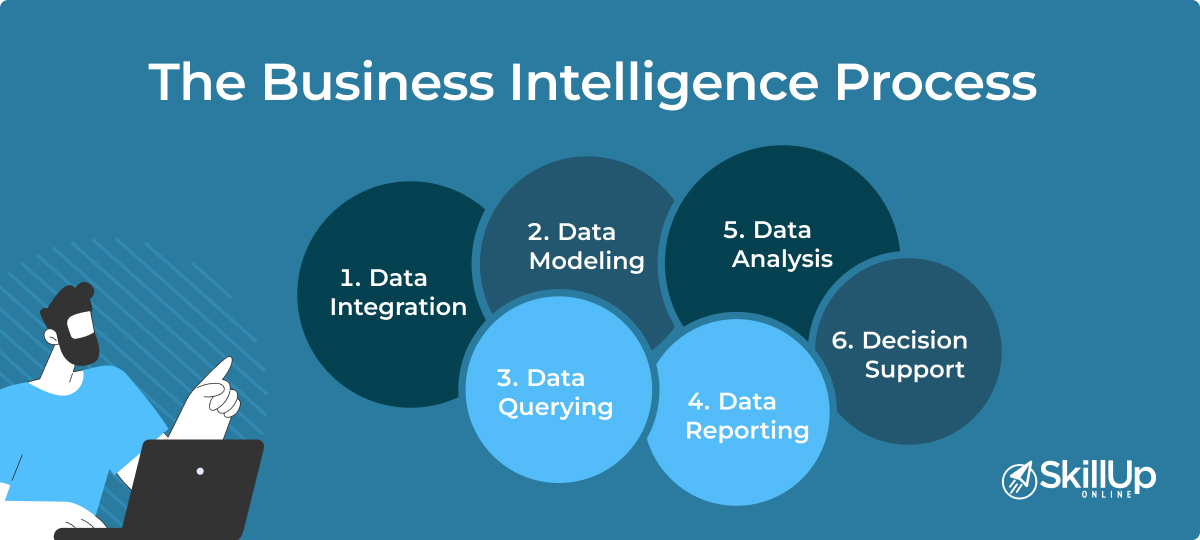
- Data Integration: Aggregating data from multiple sources into a single view for more accessible analysis.
- Data Modeling: Creating a framework that simplifies data extraction and analytics.
- Data Querying: Accessing specific data points through search functions for more focused analysis.
- Data Reporting: Compiling data into standard reports that provide insights into business performance.
- Data Analysis: Similar to data analytics, this involves a deeper dive into data to discover patterns and trends.
- Decision Support: Using the analyzed data to support business decisions, often through dashboards and other real-time tools.
Business Intelligence in Practice
BI is invaluable across all sectors:
- Sales Analysis: BI tools can track sales performance and revenue trends to guide future strategy.
- Supply Chain Management: BI provides a window into inventory levels, shipping timelines, and overall logistics.
- Executive Dashboards: These dashboards offer top executives real-time insights into various business metrics.
- CRM: Customer relationship management (CRM) systems use BI to analyze customer data and improve relationships.
For a deeper understanding of how to take data-driven decision-making to the next level, have a look at our blog on The Power of Data Analytics blog.
Key Differences Between Data Analytics and Business Intelligence
Understanding the nuances between data analytics and BI can help you decide which approach to adopt for your specific needs. Here are some of the primary distinctions:
Focus
- Data Analytics: Concentrates on examining data to find patterns, trends, and anomalies. The aim is to provide actionable insights.
- Business Intelligence: Prioritizes reporting and querying, focusing more on past and current data to aid immediate business operations.
Data Handling
- Data Analytics: Covers the entire data lifecycle, from collection to analysis and interpretation.
- Business Intelligence: Mainly concentrates on the latter stages of the data lifecycle, focusing on reporting and querying.
Time Horizon
- Data Analytics: Often operates in real-time or near real-time to offer timely insights.
- Business Intelligence: Generally deals with historical data to inform current decisions and future strategies.
User Base
- Data Analytics: Primarily geared towards analysts and data scientists who require a deep dive into data.
- Business Intelligence: Caters to a broader audience, including executives and operational teams who need quick data interpretation.
Tools
- Data Analytics: Commonly uses programming languages like Python and R and incorporates machine learning algorithms.
- Business Intelligence: Relies on platforms like Tableau and Power BI for visualization and reporting.

If you are looking to expand your knowledge and skill levels in BI and data analytics, SkillUp Online offers a Microsoft PL-300 Power BI Data Analyst course. This course helps you discover how to access and process data and then helps you learn how to create visually exciting dashboards to depict the data.
👉 Check our Data Analytics course
Harnessing the Power of Data
Both data analytics and BI offer unique benefits, but their real power lies in their integration. When used together, they provide organizations with a 360-degree view of their data landscape, offering a mix of deep insights and immediate actionable data.
Data analytics enables you to dig deep into data for comprehensive insights. At the same time, BI offers rapid reporting for quick, data-driven decision-making. By combining these approaches, you get a real-time, actionable view that’s backed by robust, in-depth analysis. This makes for an indispensable toolkit in today’s fiercely competitive business environment.
For you’re looking to harness the full spectrum of data utility, a well-rounded skill set in both data analytics and BI is invaluable. Building dual competencies can help you set yourself up for a successful career in any data-driven role.
If you would like to know more about how you can build the necessary skills and get started in data analytics and BI, contact our Learner Support Team at [email protected]. They will be more than happy to guide you on your next steps.

SkillUp Online