Workdays feel more productive when you can retrieve your own data because you no longer have to wait on other departments for essential answers. Most professionals want the freedom to make quick decisions based on insights gathered independently, which is why a lot of them are learning data analysis skills. Since analytical thinking is now one skill that most employers demand, with 7 in 10 companies listing it as essential, and 50% of the global workforce is already engaged in active reskilling or upskilling, building efficient habits is essential for staying ahead.
If you’re wondering “how can I improve my data analysis skills”, the following sections provide a clear path for building the technical confidence required to handle complex business data on your own.
The State of Data Analysis in 2026
The current business environment prioritizes efficiency and requires everyone to understand metrics that drive growth. If you can identify where a company loses money or finds new opportunities, you immediately become a more influential member of the staff. Possessing strong data analysis skills keeps your career moving forward even during times of economic uncertainty. These abilities have become a standard part of professional life for anyone who wants to remain relevant in their field.
How Data Literacy Became a Cross-Role Expectation
Data analysis is now a cross-role expectation for marketing managers, operations leads, and product directors.
- Companies expect you to understand your own metrics because waiting for technical reports can slow down the department
- Professionals who interpret their own datasets stand out as capable and driven leaders
How Weak Data Skills Hold You Back
Lacking confidence with data creates daily friction and limits your authority at work. This hesitation often prevents you from contributing to high-level discussions which can affect your career progression in specific ways.
- Losing high-value project opportunities due to not having evidence-backed ideas
- Spending hours on manual spreadsheet tasks instead of strategic thinking
- Feeling anxious about job security as technology reshapes daily business tasks
Where Do You Actually Stand?
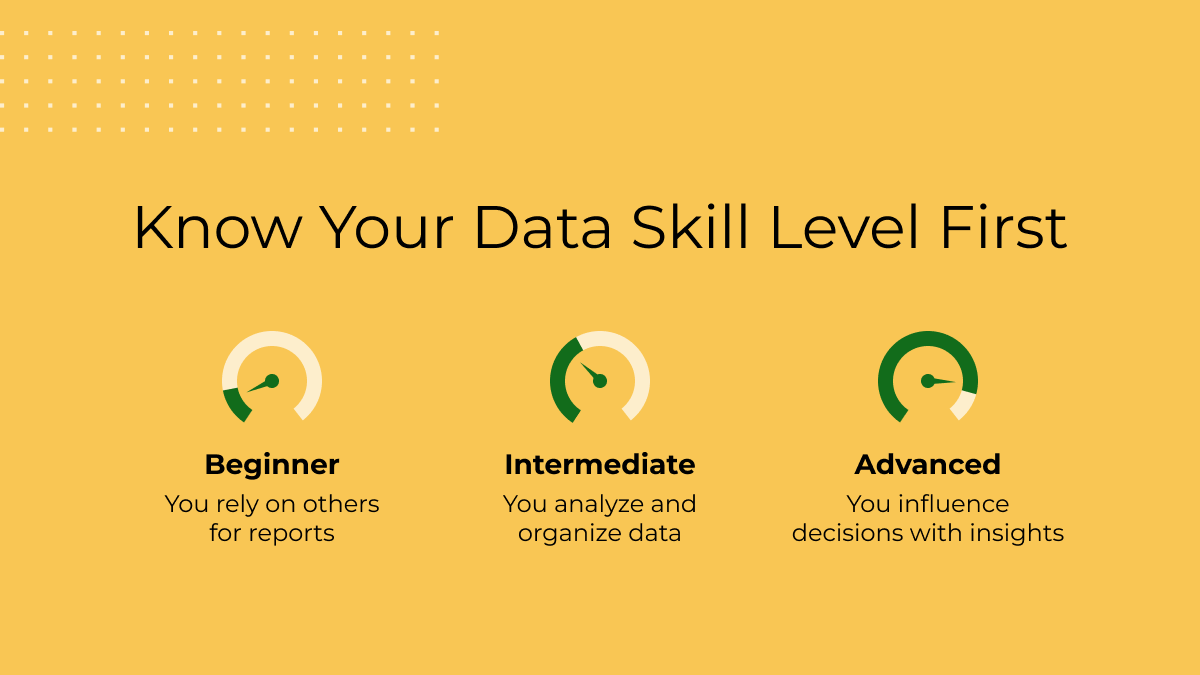
Assessing your current capabilities gives you a clear starting point for growth and prevents you from re-learning skills you already know. Review data analysis technical skills to choose the most effective training for your specific goals.
Levels of Data Proficiency and How to Place Yourself
Understanding your current ability helps you choose the right learning path for your career level.
| Proficiency Level | Your Daily Reality | Immediate Action Step |
|---|---|---|
| Beginner | You rely on others to export files and set up tracking. | Learn the steps to generate one report you view daily. |
| Intermediate | You filter information and use advanced spreadsheet functions. | Build an automated dashboard by connecting two data sources. |
| Advanced | You build predictive models and influence company strategy. | Focus on explaining complex models to executives in simple terms. |
Questions to Help Decide What to Learn Next
You need a clear direction before spending time on a course. Ask yourself these questions to map out your next steps:
- Which daily tasks take the longest to complete manually?
- Which software platforms do I use without knowing their full potential?
- What specific data analysis skills are needed for the next career step I’m aiming for?
Technical Data Analyst Skills Worth Building
Specific software tools power the corporate world today and mastering these platforms gives you the power to deal with large datasets. Review the table below to see which data analyst technical skills align with your goals.
| Software Tool | Real-World Application | First Step to Learn |
|---|---|---|
| SQL | Extracting customer segments from databases. | Request read-only access to a database testing environment. |
| Python | Automating weekly reporting and cleaning messy datasets. | Write a script to merge two spreadsheets automatically. |
| Spreadsheets | Building interactive tables for team use. | Practice pivot tables with your latest project metrics. |
| Visualization | Showing revenue trends clearly to executives. | Build a simple dashboard showing your monthly performance. |
SQL: Querying, Filtering, and Pulling Meaningful Data
Almost every major company stores information in relational databases. SQL allows you to communicate directly with those databases to extract customer segments and combine different tables.
- Find the name of the database software your company uses
- Ask a technical colleague about the structure of your company tables
- Practice writing commands to generate your own weekly reports
Python: Automation, Cleaning, and Exploratory Analysis
Many professionals spend hours manually transferring information between sheets. Python eliminates this repetitive work and handles massive datasets, so you can free up time for strategic thinking.
- Identify a repetitive reporting task you do every Friday
- Write a simple script to clean the source files for that task
- Set the script to run automatically and measure the hours saved
Excel and Google Sheets: Underused Advanced Functions
The power of spreadsheets lies in advanced indexing and power queries that enable building interactive tools and merging different files in seconds. Develop advanced Excel and Google Sheets capability with repeated practices such as:
- Stop using manual copy and paste for one full week
- Learn index match functions to combine information from multiple tabs
- Create a clean summary page using dynamic formulas
Tableau and Power BI: Turn Data Into Visualizations
Raw numbers rarely convince stakeholders, and data-backed visual analysis can help drive important decisions. Tools like Tableau and Power BI allow you to build dashboards that show data trends clearly.
- Identify charts in your last presentation that look complicated
- Rebuild those charts to highlight one important metric per slide in the next review
Statistics and Probability: The Foundation
A strong grasp of statistics helps you determine if a trend is mathematically significant or entirely random. Knowing probability helps you assess risk and make accurate forecasts for the next quarter.
- Review department goals and calculate the probability of hitting them
- Investigate the root cause of outliers in your latest report
- Use standard deviation to explain performance variations to leadership
How Skill Priorities Shift at Every Career Stage
Success in a role at any level requires a specific focus that changes as you move toward leadership. Your priorities must shift to remain effective as you climb the corporate ladder.
Entry-Level: The Starting Focus Defined
Developing entry-level data analysis skills centers on execution and tool mastery. Your primary goal is to become fast and accurate at cleaning datasets and organizing information.
- Memorize keyboard shortcuts for your primary software tools
- Volunteer to clean messy files for senior colleagues to gain exposure
- Double-check every metric before sending reports to your manager
Mid-Career: From Reporting to Business-Facing Insight
Developing mid-career data analysis skills involves connecting technical work to company revenue. You move from answering simple questions to solving complex business problems.
- Structure your projects around reducing costs or increasing retention
- Ask department heads about their biggest operational bottlenecks
- Design automated solutions that address those bottlenecks directly
Senior Level: Influence and Technical Depth
Mastering senior-level data analysis skills requires a focus on leadership and strategy. You design the architecture of how your company handles information and ensure reporting aligns with the corporate vision.
- Translate complex technical systems into plain language for the board
- Evaluate your software stack for efficiency and cost
- Establish clear documentation and training for new team members
Analytical Skills No Course Teaches You
Software tools handle calculations, but your brain handles strategy. The best professionals combine technical execution with business understanding to ensure their work has impact.
Asking Questions Before Opening Any Dataset
Professionals sometimes spend time on a problem before realizing they are answering the wrong question! Technical software cannot identify what the business needs, so you must clarify requirements with stakeholders first.
- Schedule a meeting with the stakeholder requesting the report
- Ask what decision hinges on the findings you will provide
- Draft a mockup using dummy data to confirm you understand the goal
Structuring Findings For Non-Analysts
Your findings provide value only when others can understand them easily. You must structure presentations around the practical needs of your audience.
- Put the main conclusion and financial impact on the first slide
- Remove complex technical terms and acronyms from your presentation.
- Provide a specific list of recommended actions based on the analysis
Recognizing Bias in Data
Business leaders often have a preferred outcome in mind, which creates a challenge for objective analysis. You must build the discipline to look for missing information and biased data.
- Actively search for data that disproves your initial theory
- Verify the sample size represents the whole customer base accurately
- Present multiple interpretations of the data to your leadership team
Where AI Fits Into a Data Analysis Skill Set
Artificial intelligence changes how professionals handle daily tasks. Integrating these tools saves time while you maintain your unique value as a human worker.
AI-Assisted Analysis: What It Replaces and What It Doesn’t
AI handles repetitive tasks like generating code and formatting text. But, human professionals provide strategic context and security checks by understanding company policies and customer needs.
- Use AI to write the first draft of database queries
- Review every line of AI-generated code for accuracy
- Apply company knowledge to ensure output makes sense
Tools in Real Analyst Workflows
Modern professionals use AI assistants like Copilot and ChatGPT to speed up daily tasks and troubleshoot errors. This routine saves hours of frustration and manual typing.
- Paste error messages into AI for a plain-English explanation
- Ask the assistant for the most effective chart format for your dataset
- Request formatting templates to make your messy spreadsheets readable
- Prompt for quick merging and data wrangling with raw data dumps and files
Why AI Cannot Replicate Human Judgment
An AI model processes the information it receives, but it might not know about external factors like a change in tracking software. Your historical knowledge keeps the business running accurately.
Effective Ways to Actually Build These Skills
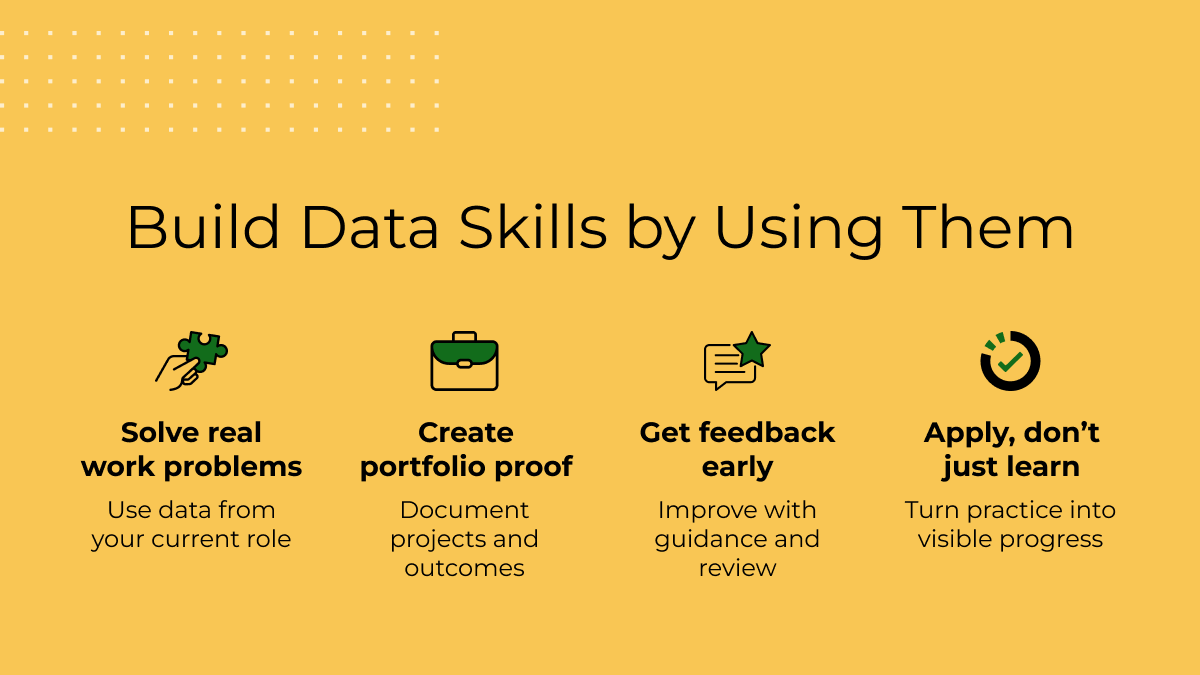
Reading about software tools rarely translates into capability. You must apply concepts to real projects. When researching the best ways to improve data analysis skills in 2026, practical application is your top priority.
Solving Business Problems Within Your Current Role
Practicing on sample files rarely prepares you for real office challenges. Applying new techniques to your actual job proves your capability to your employer immediately. Depending on your role, this can be identifying a messy dataset you use every week and apply a new function to automate part of the cleaning process.
Building a Portfolio That Proves Competency
You need proof of your work impact when looking for jobs or requesting a promotion, and a good portfolio can provide the right context that any manager or recruiter needs. If you don’t have a portfolio yet, begin with some easy steps:
- Document a business problem you solved using data
- Write down the steps and software tools you used
- Highlight the final financial result or time saved in your professional profile
Structured Learning With Mentorship
Many professionals try to learn from random videos but quit due to a lack of direction. Your time is valuable and you need a structured pathway with accountability to succeed. Learn through an organized pathway from online courses designed for mid-career professionals. You can build capability through programs like the TechMaster Certificate Program in Data Analytics and IBM Data Analyst Professional Certificate with dedicated mentors.
Read More – Data Analytics: Definition, Uses, Examples, and More

SkillUp Online