
A data analyst works with data that is often incomplete, uneven, or spread across several systems, then turns it into findings a business can use to act with more confidence. According to Fortune Business Insights, the global data analytics market is projected to grow from USD 104.39 billion in 2026 to USD 495.87 billion by 2034, exhibiting a CAGR of 21.50%. So, if you’re passionate about the field, now is the time to enter and create a space for yourself.
This guide covers what the role involves, the skills employers look for, salary ranges in 2026, and the path working professionals can follow to move into data analytics.
What Is Data Analysis and Why Does It Matter Now?
Data analysis is the process of collecting, cleaning, organizing, and interpreting data so it can support a decision. It can be descriptive, diagnostic, predictive, or prescriptive, depending on the question. In plain terms, it is the work of moving from “what is in the data?” to “what should the business do next?”
The reason it keeps growing in importance is simple. Companies gather more data than they can read manually, and that data often sits across systems that do not speak to one another. A sales team may track campaigns, a finance team may track revenue, and operations may track workflow. Data analysis connects those pieces. It gives leaders a cleaner view of trends, gaps, and risks before they make a decision.
What Does a Data Analyst Do Day-to-Day?
A data analyst works through a fairly consistent workflow, even though the exact tools change from company to company. In a small business, one person may handle the entire pipeline. In a larger firm, the role is often narrower, with different people handling reporting, dashboarding, modeling, or business insights.
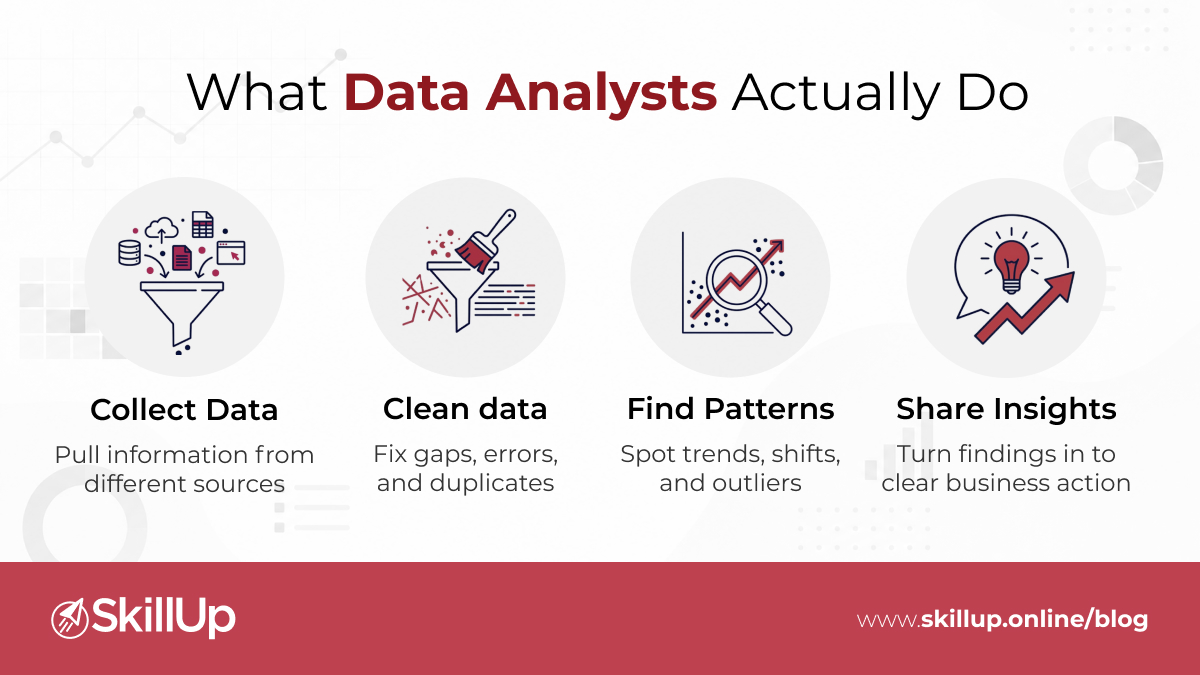
Core day-to-day work
- Pull data from different sources such as spreadsheets, databases, dashboards, or internal systems
- Clean the data by fixing missing values, removing duplicates, and checking for errors
- Sort and structure datasets so the information can be analyzed without distortion
- Run queries and calculations to find trends, shifts, and outliers
- Build reports and dashboards that make the results easy for others to read
- Explain the findings in clear language so managers can act on them
What the role looks like at different company sizes
Small and mid-sized businesses: the data analyst often owns the full workflow, from raw data to final report
Large organizations: the work is usually specialized. One analyst may focus on SQL, another on reporting, and another on stakeholder communication
Data Analyst Skills Employers Look For
Employers expect a strong technical base. For a data analyst, that usually starts with SQL, spreadsheets, and data visualization. Python or R can help with deeper analysis, and basic statistics is still part of the job because incorrect interpretation can lead to bad decisions.
Technical skills
- SQL
- Excel or Google Sheets
- Python or R
- Tableau, Power BI, or a similar visualization tool
- Basic statistics
- Data cleaning and quality checks
Business and communication skills
- Clear writing
- Strong judgment
- Problem framing
- Presentation skills
- Attention to detail
- Ability to explain findings to non-technical people
AI fluency now sits in the middle of that skill set. Analysts who can work alongside AI tools, check outputs, and use them responsibly have an edge in hiring. One labor-market study found that job postings asking for AI skills offered 28% higher salaries, or about $18,000 more per year, than similar postings without those skills. It also found that more than half of AI-skill postings were outside IT and computer science, which shows the advantage is spreading across business roles, not staying in technical teams alone.
How Much Do Data Analysts Make?
How much data analysts make depends on experience, company size, and location. A single average hides too much. The cleaner view is a salary range by career stage. Salary.com’s 2026 US data show the following progression:
| Experience Level | Experience | Average Salary (US) |
|---|---|---|
| Entry-level | 0–1 year | $68,348 per year |
| Early career | 1–2 years | $82,535 per year |
| Mid-level | 2–4 years | $96,989 per year |
| Senior-level | 5–8 years | $120,393 per year |
| Expert | 8+ years | $156,085 per year |
Source: Salary[dot]com
That spread is useful because a data analyst role rarely stays static. At the lower end, work is more task-based and supervised. At the higher end, the analyst is often trusted to define the question, choose the method, and present the business impact without much hand-holding. The salary difference reflects that wider responsibility.
Pay can move further when the role includes stronger AI usage, business exposure, or ownership of important dashboards and reporting systems. Market research from Lightcast shows that postings asking for AI skills carry a clear premium over similar roles that do not ask for them.
How to Become a Data Analyst: A Path for Working Professionals
The most practical way into data analysis is to build skills in a way that fits your current job. For working professionals, that usually means learning the tools, using them on real datasets, and showing proof of work through a portfolio.
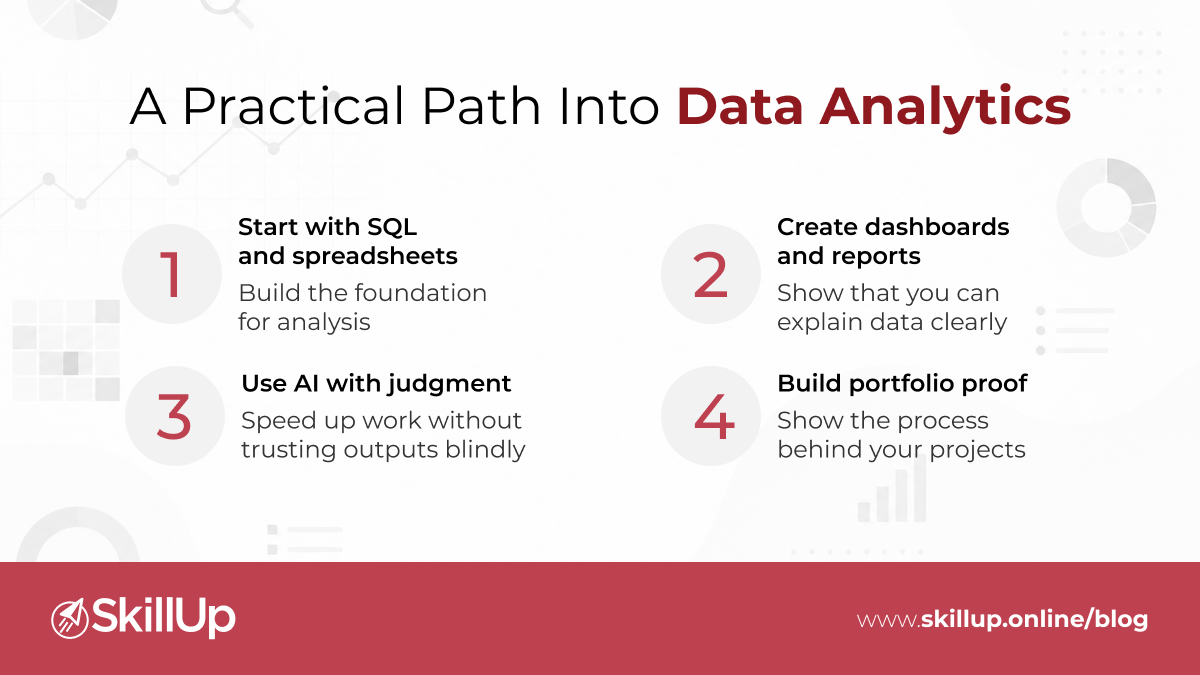
Step 1: Start with SQL and spreadsheets
Learn how to pull, sort, filter, and compare data. SQL and Excel are the starting points for most data analyst roles.
Step 2: Build a basic understanding of statistics
Learn how to read averages, percentages, trends, and variations properly. This helps you avoid drawing the wrong conclusion from the data.
Step 3: Practice cleaning messy data
Work with incomplete, duplicate, or inconsistent data. A data analyst spends a large part of the job fixing data before analyzing it.
Step 4: Create one dashboard and one report
Use real data to build a simple dashboard and a short-written summary. This shows that you can turn numbers into something useful.
Step 5: Learn a visualization tool
Pick one tool, such as Power BI or Tableau, and become comfortable using it to present findings clearly.
Step 6: Use AI tools with care
Use AI for drafting, checking, or speeding up routine tasks, but always review the output yourself. Employers value judgment, not blind tool use.
Step 7: Build a portfolio that shows your process
Include the problem, the data, the steps you took, and the final result. A strong portfolio tells the story behind the work.
What helps with the transition
- A project tied to a real business problem
- Feedback from someone already working in analytics
- Practice explaining results in simple language
- Consistent effort over time
For working professionals making a deliberate move, our TechMaster Certificate Program in Data Analytics can fit into this path by giving structure to the learning process without forcing a full career reset. The strongest results usually come from pairing the study with applied work and showing that work clearly in interviews. SkillUp Online can sit in that process as one structured option.

A good data analyst is not defined by one tool. The role depends on judgment, clear thinking, and the ability to turn data into a decision someone else can use. In 2026, that still carries value across industries, especially when combined with AI fluency, business sense, and strong communication.

SkillUp Online